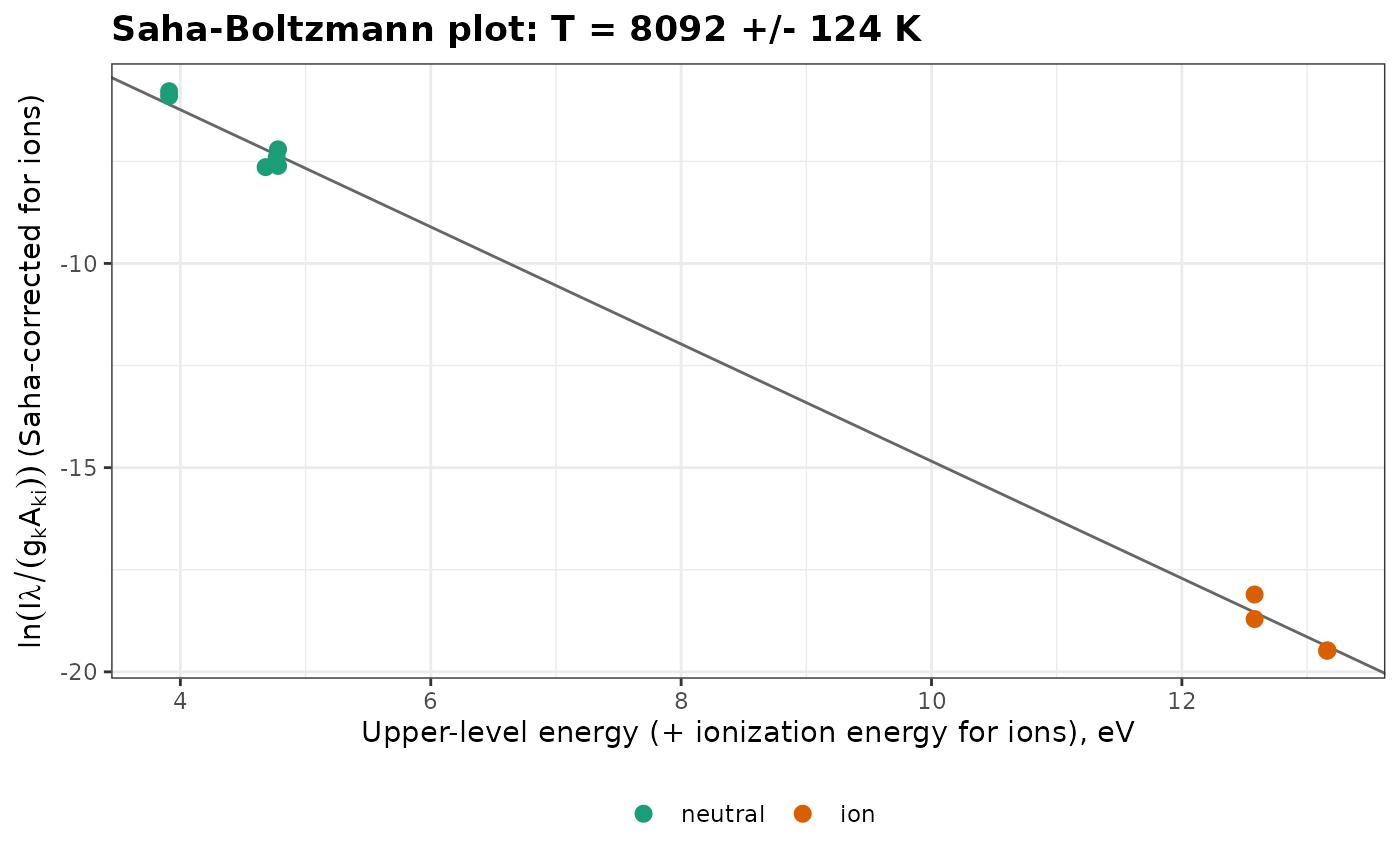
Plots the points and the fitted line of boltzmann() or
saha_boltzmann(), with the estimated temperature, or the parallel
Boltzmann plots of the species of cf_libs().
Arguments
- object
An object returned by
boltzmann(),saha_boltzmann()orcf_libs().- title
The plot title. By default, the method and temperature.
Examples
data(forageLIBS)
mean_spectrum <- colMeans(forageLIBS[-(1:14)])
# calcium lines, with their atomic data from the NIST database
atomic <- data.frame(
  species = c(rep("Ca I", 6), rep("Ca II", 4)),
  stage = c(rep(1, 6), rep(2, 4)),
  wavelength = c(428.301, 430.253, 431.865, 445.478, 612.222, 616.217,
                 315.887, 317.933, 370.603, 373.690),
  Aki = c(4.34e7, 1.36e8, 7.40e7, 8.70e7, 2.87e7, 4.77e7, 3.10e8, 3.60e8, 8.80e7, 1.70e8),
  gk = c(5, 5, 3, 7, 3, 3, 4, 6, 2, 2),
  Ek = c(4.780, 4.780, 4.769, 4.681, 3.910, 3.910, 7.047, 7.050, 6.468, 6.468)
)
lines <- line_intensities(mean_spectrum, atomic, baseline = TRUE)
plot_boltzmann(saha_boltzmann(lines, ionization_energy = 6.113, electron_density = 1.9e17))