Laser-induced breakdown spectroscopy (LIBS) spectra of 365 forage samples (368 measurements), together with their reference contents of 12 elements measured by conventional laboratory analysis.
Format
A tibble with 368 rows and 7166 columns:
- Measurement
Measurement identifier.
- Sample
Sample identifier (365 samples).
- Ca, Cl, Mg, P, K, Na, S
Macro-element content, in percent.
- Cu, Fe, Mn, Mo, Zn
Trace-element content, in mg/kg.
- 199.3771616, ..., 822.1848577
Emission intensity (counts) at each wavelength, in nm. The column names are the wavelengths.
Source
Laboratory LIBS measurements provided by Christian L. Goueguel.
The script data-raw/forageLIBS.R in the package source builds the data
set from the shot-level export.
Details
Each measurement is the mean of 8 laser shots, rounded to integer counts; the shot-level spectra are not included, to keep the package small. Three samples were measured twice, so there are 368 measurements of 365 samples. Keep the measurements of a sample together when splitting the data into calibration and validation sets.
The spectra cover 199.4 to 822.2 nm in 7152 channels (about 0.084 nm per channel) and are raw detector counts (no background subtraction or normalization). They are recorded by several spectrometers whose ranges are concatenated: the channels are in increasing wavelength order except near 766 nm, where two spectrometers overlap by about 0.43 nm, and there are gaps between 781.5 and 789.2 nm and between 800.7 and 813.9 nm. The detector saturates at 65535 counts: the strongest lines (Ca II 393.37/396.85 nm, K I 766.49/769.90 nm, Mg II 279.55/280.27 nm) are saturated in many shots and are nonlinear in concentration.
Reference values are missing for some elements (see the examples). Cu and Mo are available for only a minority of samples.
Examples
data(forageLIBS)
dim(forageLIBS)
#> [1]  368 7166
colSums(!is.na(forageLIBS[3:14])) # available reference values per element
#>  Ca  Cl  Cu  Fe  Mg  Mn  Mo   P   K  Na   S  Zn
#> 368 367  22 365 368 368 194 368 368 368 366 367

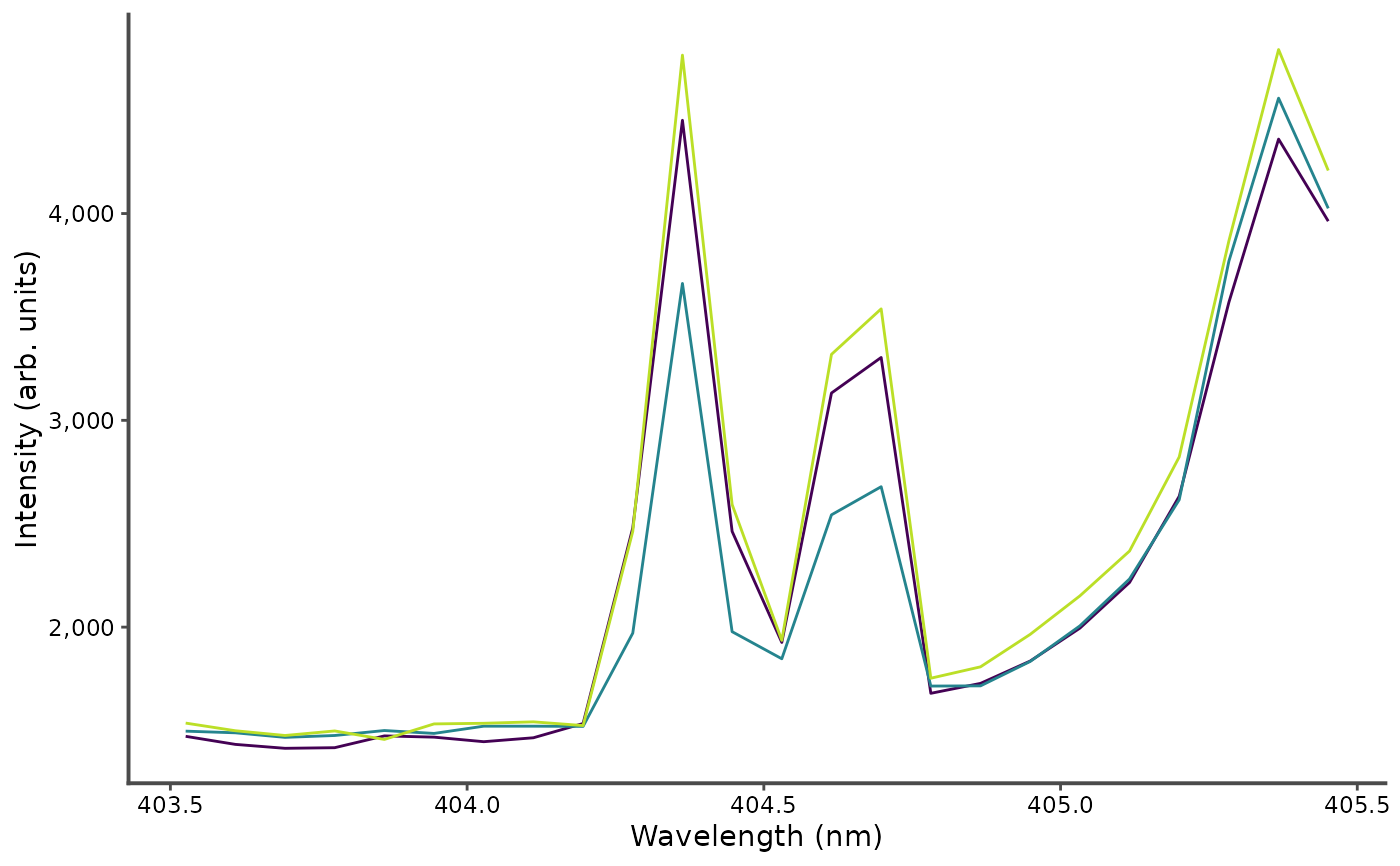
# K I doublet of the first three measurements
wl <- as.numeric(names(forageLIBS)[-(1:14)])
keep <- names(forageLIBS)[-(1:14)][wl > 403.5 & wl < 405.5]
plot_spectra(forageLIBS[1:3, c("Measurement", keep)], id = Measurement)