specProc adds the "rsimpls" engine to parsnip::pls(), which fits the
robust PLS regression of rsimpls(): outlying spectra and wrong reference
values have little influence on the model. It can be tuned, resampled and
combined with recipes like any parsnip model.
Details
The engine is available once parsnip and specProc are both loaded, in
either order. It is for regression only, with one or several outcomes
(for example cbind(y1, y2) ~ .).
Tuning parameters
num_comp(ncompofrsimpls()): the number of PLS components. It has no default and must be given (or tuned). It can be tuned withtune::tune(), usingdials::num_comp().predictor_prop, the proportion of predictors of sparse PLS, is not used by this engine.
The models with 1 to kmax components all come from the same ROBPCA fit
(see rsimpls()), so parsnip::multi_predict() gives the predictions of
all of them from one fit, and tune::tune_grid() fits a single model per
resample for a grid of num_comp. The predictions of a model with fewer
components are those of a separate fit with the same kmax, as long as
kmax is at least the largest num_comp.
Engine arguments
The other arguments of rsimpls() are set with parsnip::set_engine():
kmax, the largest number of components (default 10), alpha, the
fraction of observations assumed to be regular (default 0.75), and
ndir and nsamp of the ROBPCA step.
Preprocessing and randomness
The predictors are centered robustly by the model, and are not scaled:
scale them beforehand if their units differ. Factor predictors are
converted to indicator variables. rsimpls() uses random directions and
subsets, so use set.seed() before fitting for reproducible results.
Outlier diagnostics
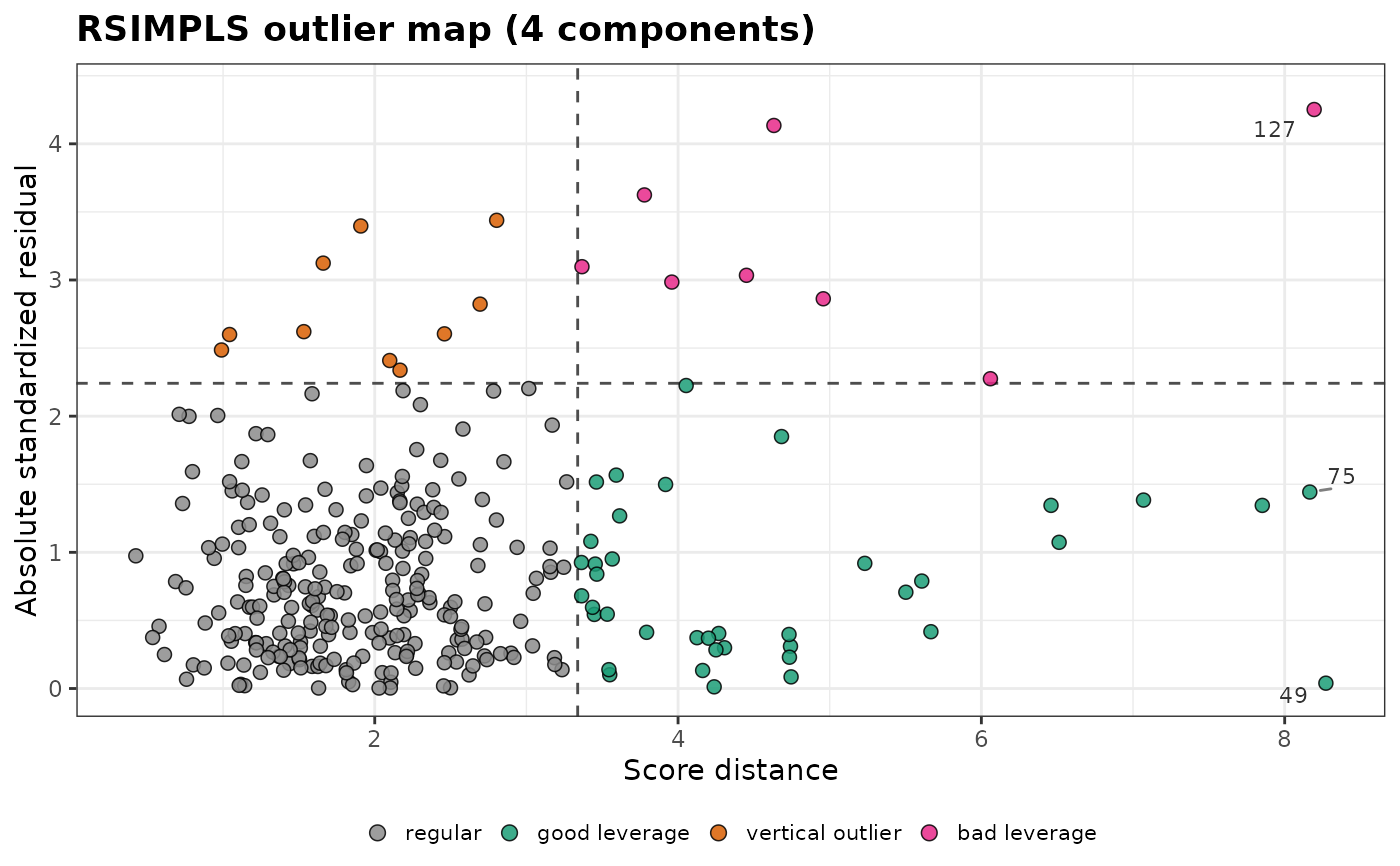
The fitted rsimpls() model is returned by
parsnip::extract_fit_engine(), for its outlier maps
(plot_outlier_map()) and distances.
Examples
library(parsnip)
data(forageLIBS)
# calcium and the Ca II and Ca I lines
wl <- suppressWarnings(as.numeric(names(forageLIBS)))
dat <- forageLIBS[c(which(names(forageLIBS) == "Ca"), which(wl > 380 & wl < 430))]
spec <- pls(num_comp = 4) |>
  set_engine("rsimpls") |>
  set_mode("regression")
set.seed(1)
fit <- fit(spec, Ca ~ ., data = dat[1:300, ])
predict(fit, dat[301:368, ])
#> # A tibble: 68 × 1
#>    .pred
#>    <dbl>
#>  1 0.416
#>  2 0.547
#>  3 0.723
#>  4 0.621
#>  5 0.810
#>  6 0.186
#>  7 0.451
#>  8 0.668
#>  9 0.789
#> 10 0.547
#> # ℹ 58 more rows
# predictions with 1 to 4 components
multi_predict(fit, dat[301:303, ], num_comp = 1:4)$.pred[[1]]
#> # A tibble: 4 × 2
#>   num_comp .pred
#>      <int> <dbl>
#> 1        1 0.470
#> 2        2 0.573
#> 3        3 0.471
#> 4        4 0.416
plot_outlier_map(extract_fit_engine(fit))