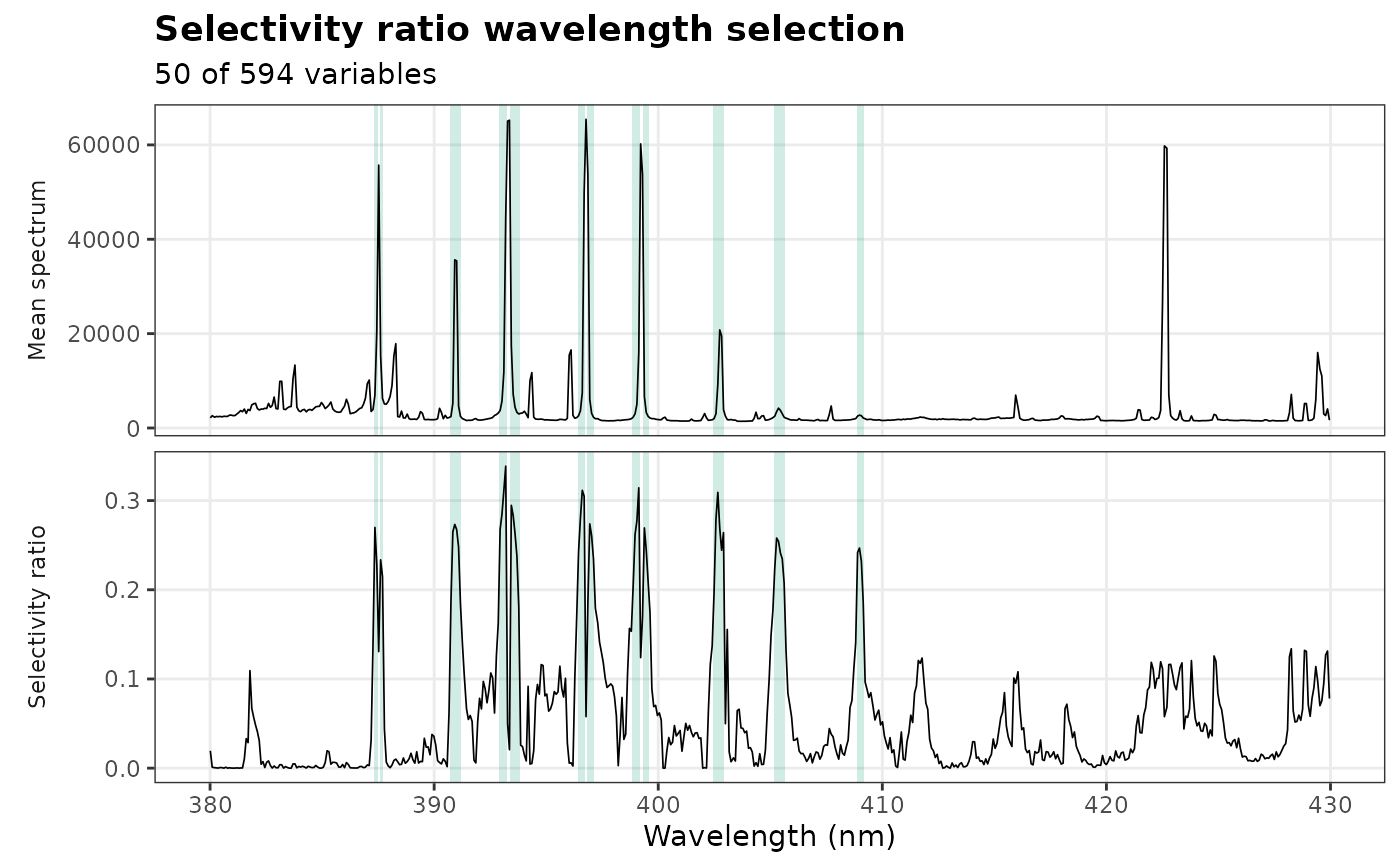
Shows the variables selected by select_wavelengths(): the mean
spectrum, with the selected regions shaded, above the importance of each
variable (VIP or selectivity ratio, with the threshold when one was
used) or, for iPLS, the RMSECV of each interval alone, with the selected
intervals colored.
Arguments
- object
An object returned by
select_wavelengths().- title
The plot title.
Examples
data(forageLIBS)
wl <- suppressWarnings(as.numeric(names(forageLIBS)))
spectra <- forageLIBS[which(wl > 380 & wl < 430)]
sel <- select_wavelengths(spectra, forageLIBS$Ca, method = "sr", num_terms = 50)
plot_wavelength_selection(sel)