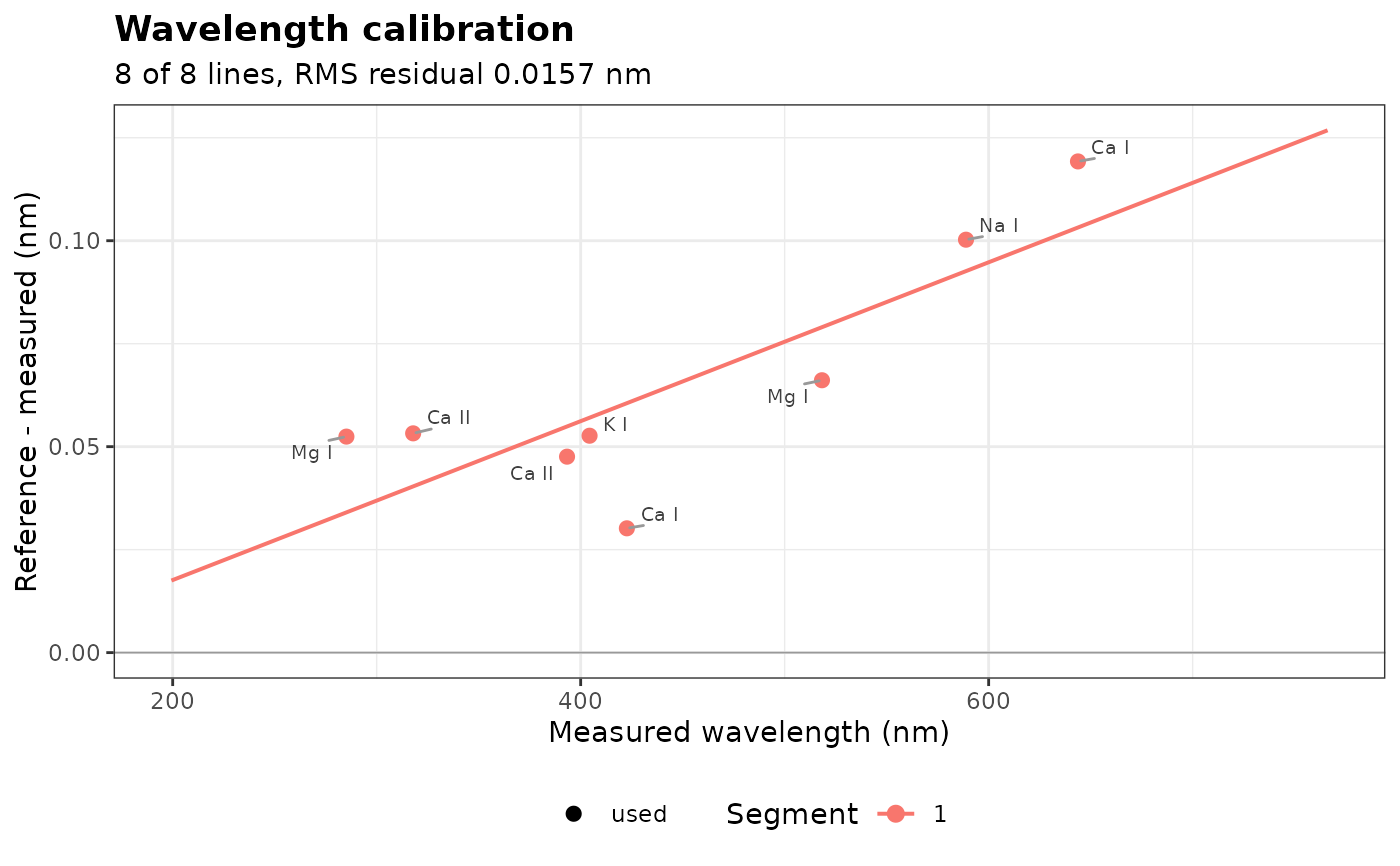
Plots the offset of each reference line (reference minus measured wavelength) against its measured wavelength, with the fitted correction of each detector segment. Lines not used are drawn as open circles and labeled with the reason.
Arguments
- object
The result of
wavelength_calibration().- title
The plot title.
Examples
data(forageLIBS)
spectra <- forageLIBS[-(1:14)]
wl <- as.numeric(names(spectra))
first_detector <- spectra[seq_len(which(diff(wl) < 0)[1])]
reference <- c(`Mg I` = 285.213, `Ca II` = 317.933, `Ca II` = 393.366, `K I` = 404.414,
               `Ca I` = 422.673, `Mg I` = 518.360, `Na I` = 588.995, `Ca I` = 643.907)
cal <- wavelength_calibration(first_detector, reference)
plot_wavelength_calibration(cal)