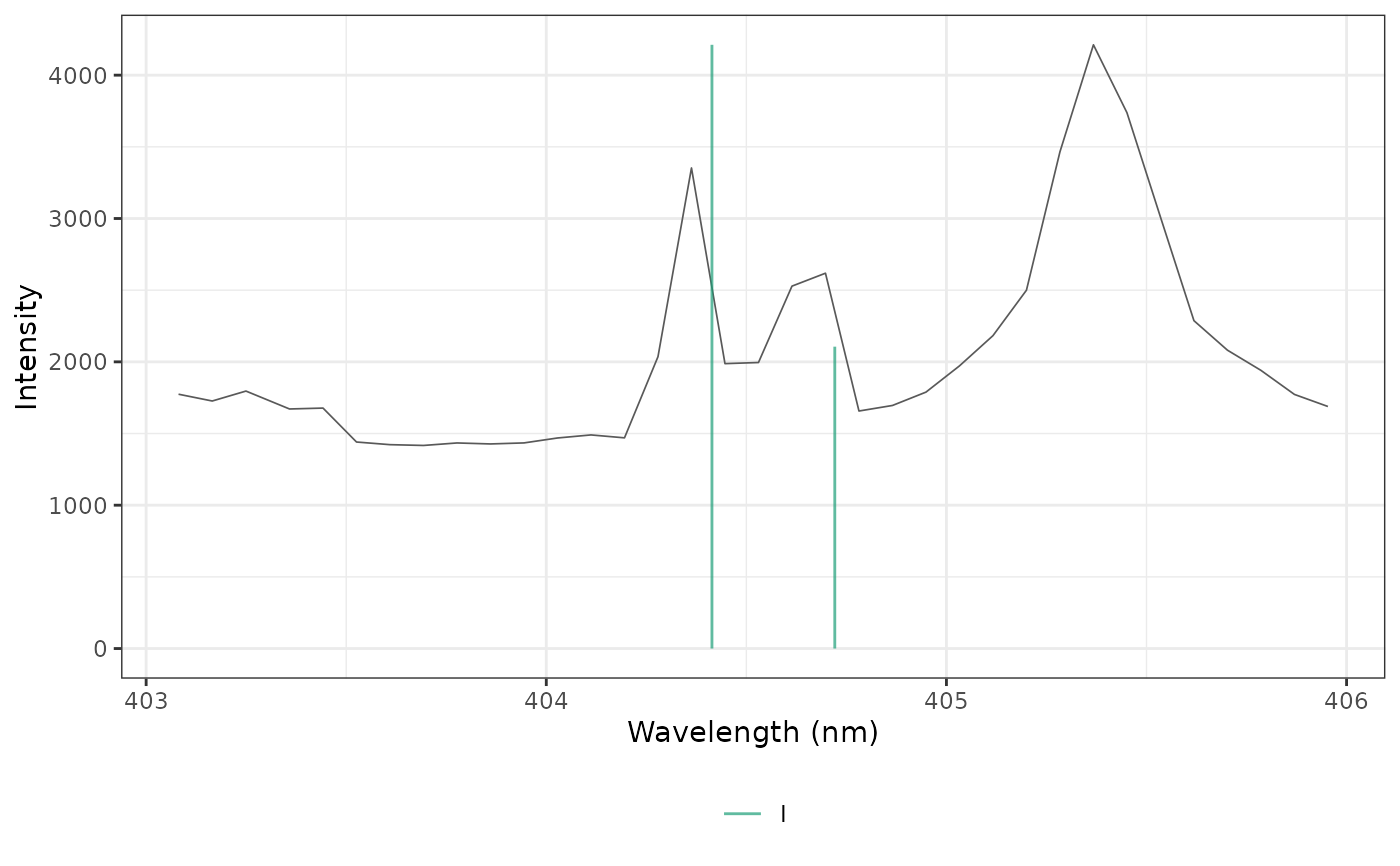
Plots a spectrum with vertical markers at the wavelengths of candidate emission lines, colored by ionization stage, to identify the lines of the spectrum.
Usage
plot_lines(
  spectrum,
  lines,
  shift = 0,
  scale_markers = TRUE,
  interactive = TRUE,
  title = NULL
)
Arguments
- spectrum
A spectrum: a numeric vector named by wavelength, or a one-row matrix or data frame whose column names are the wavelengths. Average several spectra first.
- lines
A tibble returned by
libs_lines().- shift
A wavelength shift, in nm, added to the line wavelengths to correct the wavelength calibration of the spectrometer. Default is 0.
- scale_markers
A logical: scale the markers by the relative intensity of the lines (
TRUE, default) or draw them full height.- interactive
A logical: plotly (
TRUE, default) or ggplot2.- title
An optional plot title.
Details
With interactive = TRUE, the plot is made with plotly: the spectrum is
drawn with WebGL, the lines of each ionization stage form one trace that
can be shown or hidden from the legend, and hovering over a line shows its
species, wavelength, transition probability, upper-level energy and
accuracy grade. Otherwise, a ggplot is returned.
With scale_markers = TRUE, the height of each marker is its relative
intensity (see libs_lines()) times the maximum of the spectrum;
otherwise all markers span the full height.
Examples
data(forageLIBS)
spectrum <- colMeans(forageLIBS[-(1:14)])
spectrum <- spectrum[as.numeric(names(spectrum)) > 403 & as.numeric(names(spectrum)) < 406]
# the K I doublet, with the atomic data of the NIST database
lines <- tibble::tibble(
  species = "K I", element = "K", stage = 1L, wavelength = c(404.414, 404.721),
  relative_intensity = c(1, 0.5), Aki = c(1.15e6, 1.07e6), Ek = c(3.065, 3.063),
  gk = c(4, 2), accuracy = "A", lower = "4s 2S", upper = c("5p 2P* 3/2", "5p 2P* 1/2")
)
plot_lines(spectrum, lines, interactive = FALSE)