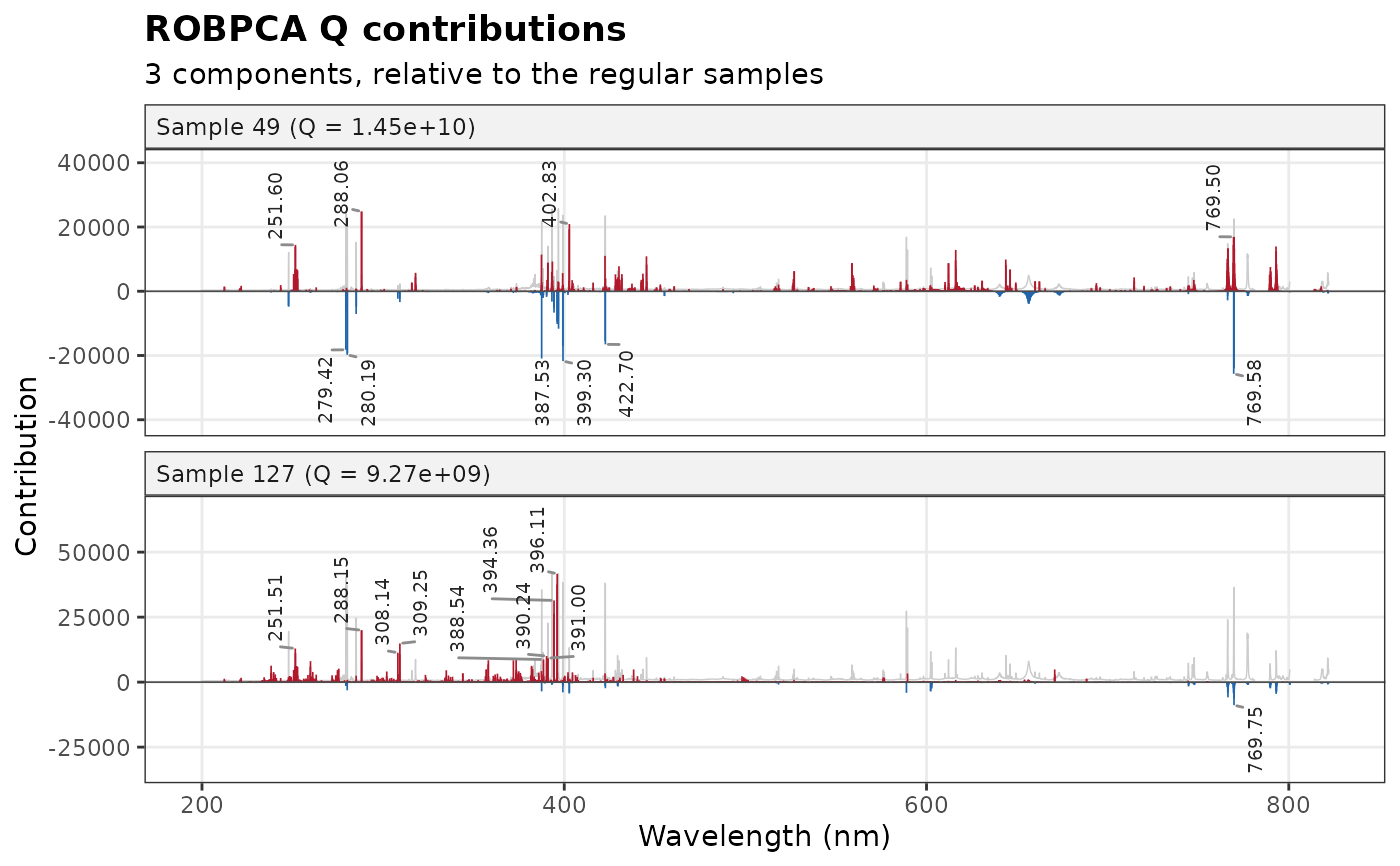
Plots the contributions of the variables to the Q residual or to the
\(T^2\) of samples (see contributions()) against wavelength, one
panel per sample, and labels the wavelengths that contribute most, with
the emission lines they match when a line list is given.
Usage
plot_contributions(
  x,
  samples = NULL,
  top = 10,
  lines = NULL,
  tol = 0.1,
  spectra = NULL,
  span = 5,
  interactive = FALSE,
  title = NULL
)
Arguments
- x
An object returned by
contributions().- samples
The samples to show (row numbers of
x, or names in itssamplecolumn). Default is the three with the largest statistic.- top
The number of peaks labeled per component (per panel). Default is 10; use 0 for no labels.
- lines
Optional line list returned by
libs_lines(), to label the peaks with the emission lines they match.- tol
The largest distance, in nm, between a peak and a line it matches. Default is 0.1.
- spectra
Optional spectra (a data frame or matrix with the variables of the model, other columns being ignored) or a single spectrum (a named numeric vector), whose mean is drawn in grey behind each panel, rescaled to it, to show whether a peak is on an emission line.
- span
The half-width, in channels, of the window in which a peak is a local extremum. Default is 5.
- interactive
If
TRUE, the plot is made with plotly, with the peaks and their candidate lines shown on hover. Default isFALSE.- title
The plot title.
Details
Each contribution is drawn red above zero (the sample is higher than the
model, or than the reference samples) and blue below. The top largest
positive and negative local extrema are labeled, as in plot_loadings():
in bold with the nearest line of lines within tol nm. The mean
spectrum can be drawn in grey behind each panel, rescaled to it.
Examples
spectra_id <- forageLIBS |> dplyr::select(1:2) |> names()
minerals <- forageLIBS |> dplyr::select(3:14) |> names()
spectra <- forageLIBS |> dplyr::select(-dplyr::all_of(c(spectra_id, minerals)))
set.seed(1)
fit <- robpca(spectra, k = 3)
q <- contributions(fit, data = spectra, samples = c(49, 127), reference = "regular")
plot_contributions(q, spectra = spectra)