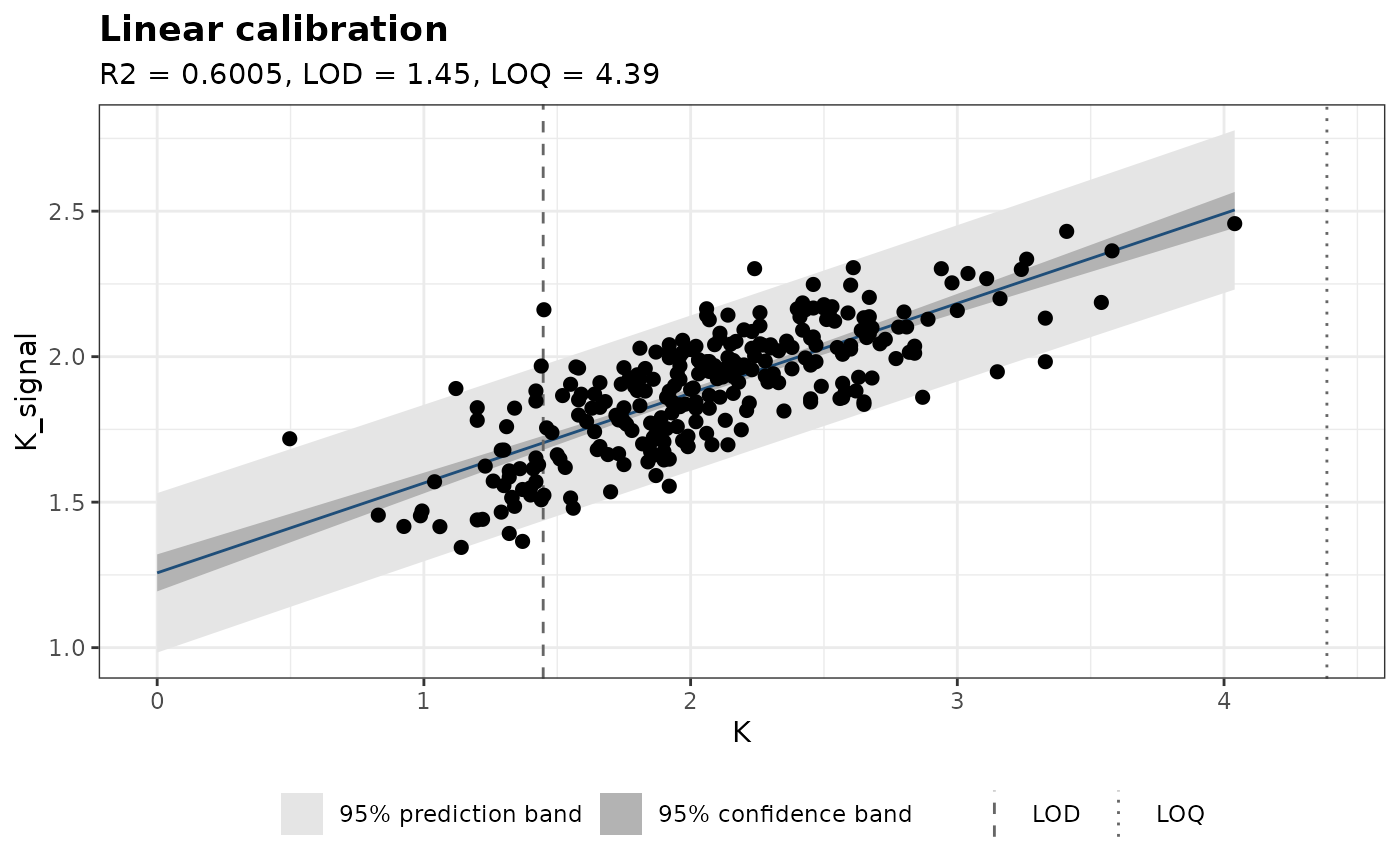
Draws the calibration standards, the fitted curve with its confidence and prediction bands, the limits of detection and quantification, and optionally the concentrations predicted for new samples.
Usage
plot_calibration(
  object,
  interval = "both",
  level = 0.95,
  newdata = NULL,
  replicates = 1,
  title = NULL
)
Arguments
- object
A curve fitted with
calibration_curve().- interval
The bands to draw:
"both"(default),"confidence","prediction"or"none".- level
The confidence level of the bands and intervals. Default is 0.95.
- newdata
Optional signals of new samples (a numeric vector, or a data frame with the signal column) to show with their predicted concentrations.
- replicates
The number of replicate measurements averaged in each new signal. Default is 1.
- title
The plot title. By default, the model and the figures of merit.
Details
The confidence band shows where the mean signal lies; the prediction
band, where a single new measurement (or the mean of replicates) is
expected to fall (see calibration_curve()). With newdata, each new
signal is drawn on the curve at its predicted concentration, with guide
lines to the axes and a horizontal bar for the interval of the
concentration from predict().
Examples
# the calibration curve of potassium of vignette("calibration")
data(forageLIBS)
spectra_id <- names(forageLIBS)[1:2]
minerals <- names(forageLIBS)[3:14]
spectra <- forageLIBS[setdiff(names(forageLIBS), c(spectra_id, minerals))]
corrected <- baseline_arpls(spectra, lambda = 1e5, max.iter = 20)$correction

# the K I 769.90 nm line, normalized to the C I 247.86 nm line of the matrix
lines <- line_intensities(corrected, c(C = 247.856, K = 769.896))
data <- forageLIBS[c(spectra_id, "K")]
data$K_signal <- lines$intensity[lines$line == "K"] / lines$intensity[lines$line == "C"]

# a quarter of the samples are set aside to test the calibration
set.seed(1)
test_samples <- sample(unique(data$Sample), round(0.25 * length(unique(data$Sample))))
calibration <- data[!data$Sample %in% test_samples, ]

k_curve <- calibration_curve(calibration, K_signal, K)
plot_calibration(k_curve)